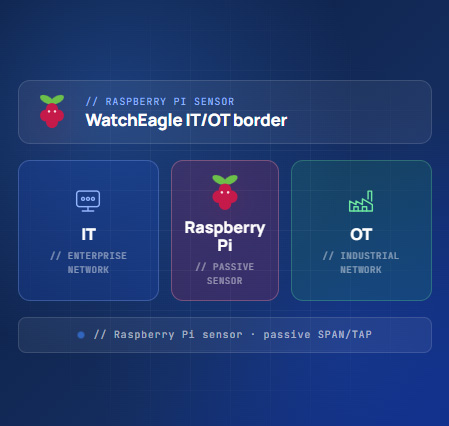
Visibility across the IT/OT boundary.
Passive network detection for industrial environments. Continuous insight into traffic flows, anomalies and threats at the most critical (and most overlooked) boundary in your organisation.
Receive insight within 30 days into your key traffic flows, anomalies and improvement areas.
Your IT is monitored. Your OT boundary is not.
Firewalls, EDR and Microsoft 365 logging are often already in place. But the boundary between IT, OT and the DMZ is where blind spots appear, and where attackers move laterally.
Modern OT environments run on standard Windows and Linux systems: SCADA servers, HMIs, historians, jump servers, OPC servers and remote access gateways. This IT-like communication is the path used during attacks, misconfigurations and lateral movement.
Passive. Non-invasive.
No production disruption.
The sensor connects via SPAN port or network TAP. No active scanning, no agents, no inline blocking, no changes to PLCs, HMIs or servers. It observes, analyses and reports. Nothing more.
Position the sensor
A compact Raspberry Pi sensor is connected passively via SPAN port or network TAP at a critical boundary point — IT/OT edge, DMZ, remote access connection or historian.
Continuous detection
The sensor analyses traffic flows, identifies protocols, detects anomalies and enriches findings with threat intelligence — all without touching a single production system.
Insight within 30 days
You receive traffic flow overviews, detected anomalies, zone crossing analysis, protocol visibility and concrete segmentation improvement recommendations.
Five layers of visibility
and detection.
From basic network visibility to OT protocol recognition, threat intelligence enrichment and monthly improvement reporting, all from a single passive sensor.
What is actually communicating
Which systems connect to each other, which protocols are active, which ports are open, which DNS requests occur and which communication crosses zone boundaries.
Anomalies and attack patterns
Scanning activity, unexpected connections to critical systems, C2 traffic, brute-force attempts, misuse of remote access and SMB traffic crossing zone boundaries.
Industrial protocol recognition
Modbus/TCP, OPC UA, Siemens S7, EtherNet/IP, DNP3 and more — even where full deep inspection is not possible, protocol recognition and traffic direction provide significant value.
Context and priority
Detected traffic is enriched against known malicious IPs, suspicious domains, ransomware infrastructure and sector-specific threat indicators.
Practical, usable insight
Monthly reporting with firewall rule recommendations, segmentation advice, zone crossing analysis and support during incident analysis.
Compact. Passive. Non-invasive.
Runs on a Raspberry Pi. Connects via SPAN port or network TAP. Nothing installed on PLCs, HMIs, servers or workstations. No changes. No scanning. No disruption.
Availability first.
No disruption.
In OT environments, availability and stability are critical. The sensor is a pure passive detection layer. It does not actively scan, does not block inline and nothing is installed on PLCs, HMIs, servers or workstations.
Real situations. Real risk.
Examples of what the sensor detects and why it matters in an OT context.
| Situation | Why it matters |
|---|---|
| An IT workstation connects directly to an OT system | Possible segmentation violation |
| A DMZ server connects to an unknown external destination | Possible compromise or data leakage |
| A supplier accesses more systems than agreed | Loss of control over remote access |
| RDP or SSH into OT outside maintenance windows | Possible misuse of management channels |
| SMB traffic between IT and OT | Possible lateral movement or ransomware risk |
| An engineering workstation communicates with a PLC network | May be legitimate, but should be explainable |
| New DNS requests originating from OT | Possible unwanted external dependency |
| Unexpected OT protocol traffic across a DMZ boundary | Possible misrouting or overly broad firewall rule |
| Scanning within OT or towards OT | Early sign of attack activity or misconfiguration |
Industrial protocols we recognise.
In addition to standard IT protocols, the sensor identifies relevant OT and industrial protocol flows where network position and traffic allow.
Practical insight, actionable output.
You receive practical, usable reporting, not raw technical alerts. The output is designed for both security teams and operational stakeholders.
Key traffic flow overview
Which systems communicate, which protocols are in use, which connections cross zone boundaries.
Notable and unusual connections
Flagged connections that deviate from expected behaviour or the intended segmentation model.
Suspicious behaviour detection
Alerts on scanning, C2 traffic, unexpected zone crossings and high-risk external destinations.
Segmentation improvement advice
Concrete recommendations for firewall rules, zone isolation and conduit improvements.
OT protocol visibility
Which industrial protocols are active, where they flow and whether they cross expected zone boundaries.
Monthly reporting
Ongoing detection, trend analysis and continuous improvement of your OT security maturity.
Managed detection,
without the complexity.
Many organisations know their OT boundary is a blind spot but lack the internal resources to address it. The WatchEagle sensor is designed to be low-threshold — place one sensor and receive insight within 30 days.
No large deployment projects. No agent rollouts. No production downtime.
-
IT/OT boundary blind spots Identified, documented and addressed with concrete recommendations.
-
Unknown communication flows Surface what is really happening between zones.
-
Supplier and remote access control Validate that third-party access stays within agreed boundaries.
-
Segmentation validation Confirm whether your network zones still match the intended design.
-
IEC 62443 support Practical input for zone/conduit models and OT risk assessments.
One sensor. Insight within 30 days.
- Compact WatchEagle sensor (Raspberry Pi)
- Passive monitoring via SPAN or TAP
- Network visibility across IT, OT and DMZ
- Detection of suspicious network behaviour
- IT and OT protocol visibility
- Threat intelligence enrichment
- WatchEagle monitoring & notifications
- Monthly reporting & improvement advice
- Segmentation and firewall recommendations
- Support during incident analysis
Getting started in 3 steps
Place one sensor At your IT/OT boundary, DMZ, remote access connection, historian or firewall SPAN port.
Receive insight within 30 days Traffic flows, protocols in use, notable connections, zone crossings and concrete improvement areas.
Improve continuously Monthly reporting, firewall and segmentation advice, and support during incidents.
Make your zone and conduit model demonstrable.
The sensor helps answer the practical questions that IEC 62443 risk assessments and segmentation reviews require.
Practical questions,
practical answers.
Will the sensor impact our production environment?
No. The sensor is purely passive — connected via SPAN port or TAP, it only receives a copy of traffic. It cannot block, modify or interfere with network communication.
Does anything need to be installed on OT systems?
Nothing. No agents, no software, no changes to PLCs, HMIs, SCADA servers or workstations. The only installation is the sensor itself at a network access point.
What does the output look like after 30 days?
You receive a practical report covering key traffic flows, protocol usage, notable or unusual connections, identified zone crossings, risky remote access patterns and concrete segmentation improvement recommendations.
How does this support IEC 62443 compliance work?
The sensor makes zone and conduit communication demonstrable — which systems communicate, which protocols cross boundaries, whether traffic matches the intended design. This provides practical input for OT risk assessments, segmentation reviews and IEC 62443-related initiatives.